Configuration: Settings
Dashboard Settings allow you set various options relating to the display and configuration of the user experience.
To access Dashboard settings from the menu bar:
- Select Tools / Settings.
While the settings in the upper Settings region affect the application’s operation, those in the lower Customization region affect only its appearance.
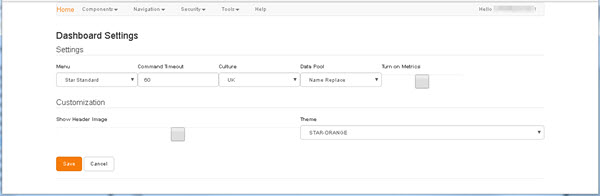
The various settings are as follows:
-
Menu - Select the menu that you want to apply to Dashboard views.
Access to menus is subject to User Group membership. For details, see Security.
- Command Timeout - Enter a value, in seconds, to specify how long the application should allow for commands to execute.
- Culture - Determines how information such as numbers, currencies and dates is formatted. Select the option most appropriate to your region: UK, US, European, or Ireland.
- Data Pool - Select the Data Pool on which you want to report (see Datasource Management).
- Turn on Metrics - .
- Show Header Image - Select this checkbox if you want to display an image within the application header.
- Theme - Select the visual theme that you want to apply to the interface.
When you are happy with the current Settings, click either:
- Apply to save any changes or
- Cancel to discard any changes and return to the Home Page.