Charts
Charts allow data to be displayed graphically, either in the format of a pie chart, or in various types of bar chart (either vertical or horizontal). Pie charts are typically used to display aged AR or aged WIP, in order to easily see variations across the aging buckets. Bar charts are typically used to display variations in AR and WIP over time, e.g. with twelve columns representing the twelve months of a year. It is possible to drill down on a chart as a whole, or even on a particular chart pie or bar.
The Chart List presents a searchable list of any Charts that have been set up in your instance of , and provides utilities with which to manage those Charts.
To access the Chart List from the menu bar:
- Select Components / Charts.
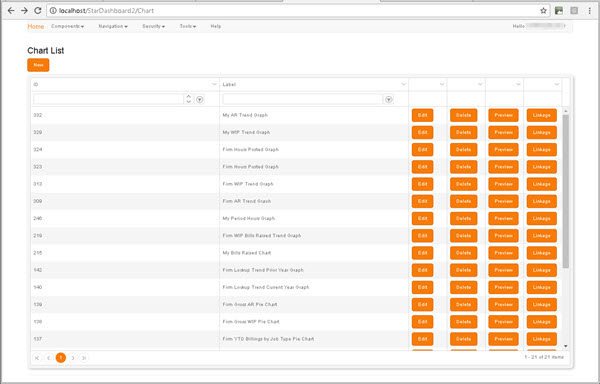
Clicking the New button beneath the Chart List heading displays the New Chart screen, in which you can begin to define a new Chart.
The grid presents a listing of each existing Charts, one per grid row.
To locate an existing Chart, use either the filters in the column headers or the scroll bar and the page navigation controls in the grid footer (for details, see Column Filters and Page Navigation).
The buttons on each row present the following options:
- Edit - Displays the Edit Chart screen.
- Delete - Displays a Delete Confirmation prompt, in which you are prompted to confirm the deletion of the Chart.
-
Preview - Displays a preview of the selected Chart in a new tab.
Previews are dependent on Group permissions. For details, see Security.
- Linkage - Displays a Report Hierarchy, which illustrates any existing links to or from the selected report, and enables you to create new links. For details, see Linkage.