Radial Gauges
Radial Gauges allow values to be displayed in the form of a gauge, similar to a speedometer, with a range of possible values spread evenly along the arc, from the minimum on the left to the maximum on the right. An indicative value is passed into the gauge, on which it is represented as a pointer rotating on a pivot point on the gauge's semi-circular arc.
Radial Gauges are typically used to compare actual results to a target (or budget) result.
Any Radial Gauges that have already been configured in your instance of are represented in the Radial Gauge List.
To access the Radial Gauge List from the menu bar:
- Select Components / Radial Gauges.
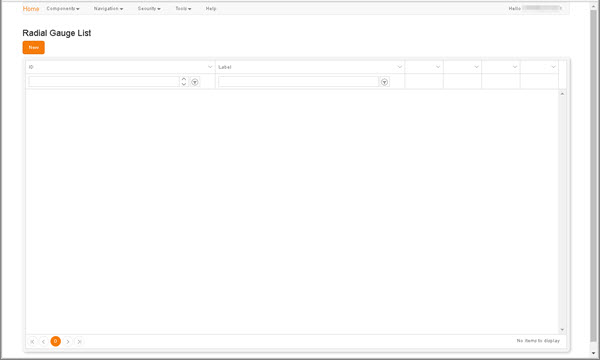
Clicking the New button beneath the Radial Gauge List heading displays the New Radial Gauge screen, in which you can begin to define a new Gauge.
The grid presents a listing of each existing Gauges, one per grid row.
To locate an existing Gauge, use either the filters in the column headers or the scroll bar and the page navigation controls in the grid footer (for details, see Column Filters and Page Navigation).
The buttons on each row present the following options:
- Edit - Displays the Update Radial Gauge screen.
- Delete - Displays a Delete Confirmation prompt, in which you are prompted to confirm the deletion of the Chart.
-
Preview - Displays a preview of the selected Gauge in a new tab.
Previews are dependent on Group permissions. For details, see Security.
- Linkage - Displays a Report Hierarchy, which illustrates any existing links to or from the selected Gauge, and enables you to create new links. For details, see Linkage.