Summary Reports
Summary Reports display data in the form of grids (Name/Value pairs arranged in a series of columns and rows). The number of columns and rows in a grid will depend on the total number of data elements to be displayed. A typical use would be to display client data such as number, name, address, partner, etc. A link can then be made from any number of these data elements to other reports.
Summary Reports are managed via the Summary Report List.
To access the Summary Report List:
- In the Setup menu bar, select Components / Summary Reports.
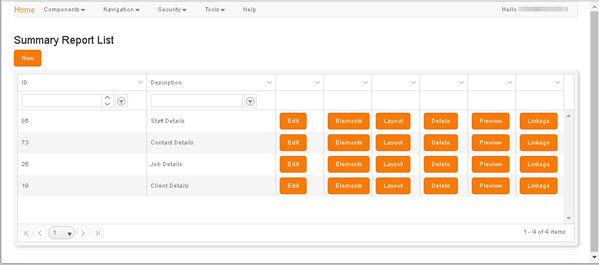
Clicking the New button beneath the Summary Report List heading displays the Create Summary Report screen, in which you can begin to define a new report.
The grid presents a listing of each existing Summary Report, one per grid row.
To locate an existing Summary Report, use either the filters in the column headers or the scroll bar and the page navigation controls in the grid footer (for details, see Column Filters and Page Navigation).
The buttons on each row present the following options:
- Edit - Displays the Edit Report screen, in which you can edit the report's listing and/or the connection with its data source (Query Definition).
- Elements - Displays the Element List, in which you can edit the labelling and format of report elements (columns).
- Layout - Displays the Layout screen, in which you can define or edit the layout of a report.
- Delete - Displays a Delete Confirmation prompt, in which you are prompted to confirm the deletion of the report.
-
Preview - Displays a preview of the selected report in a new tab.
Previews are dependent on Group permissions. For details, see Security.
- Linkage - Displays a Report Hierarchy, which illustrates any existing links to or from the selected report, and enables you to create new links. For details, see Linkage.